
Cedi Performance and Macro-Economic Indicators
Ghana’s currency at the end of the second quarter 2022 had depreciated against the major currencies. The cedi depreciated by 16.93%, 7.69% and 9.92% against the US Dollar, the British pound, and the Euro respectively on a year-to-date (YTD) basis. The depreciation of the Ghana cedi relative to the major currencies during the quarter can be attributed to forex reserve pressures due to external demands.
Headline inflation rate accelerated to 29.80% at the end of June 2022 compared to 19.40% at the end of March 2022. The surge in inflation for the end of second quarter 2022 was as a result of higher costs of transportation, household equipment and maintenance, and utilities.
The Bank of Ghana raised the monetary policy rate to 19.00% in May citing the Russia-Ukraine war, heightened inflationary pressures, and tightening global financial conditions as the reasons for the surge in Monetary Policy Rate. Inflation remained well above the Central Bank’s upper limit of the medium-term target band as global price pressures remain elevated, driven by rising food and fuel prices, and supply chain disruptions.
The table below provides details of the rates and movement in the currency market.
Economic Review
| Q1 2022 | Q2 2022 | Change (YoY) | |
| Monetary Policy Rate | 17.00% | 19.00% | 2.00% |
| Inflation Rate | 19.40% | 29.80% | 10.40% |
| Close (31st March 2022) | Close (30th June 2022) | Quarter Depreciation | |
| US Dollar/Ghana Cedi | 7.11 | 7.23 | 1.64% |
| British Pound/Ghana Cedi | 9.35 | 8.80 | 6.22% |
| Euro/Ghana Cedi | 7.90 | 7.58 | 4.21% |
Government Borrowing
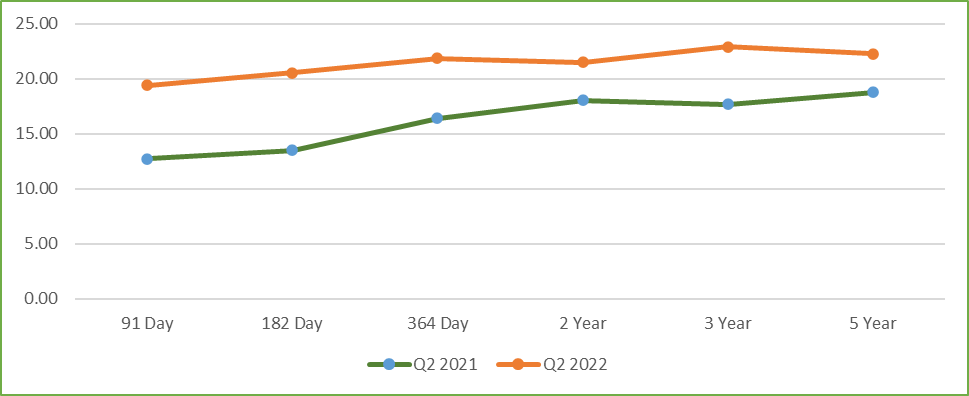
The 91-, 182- and 364-Day Treasury Bills began the second quarter of 2022 at 14.84%, 15.46% and 20.85% respectively and traded at 25.63%, 26.40% and 27.42%, respectively at the end of the quarter. The government also issued a 2-Year Note at 21.50%, a 3-Year and a 5-Year Bond at 25.00% and 22.30%, respectively. Compared to the second quarter 2021, interest rates on the longer term GoG securities have trended upwards.
| Q2 2021 | Q2 2022 | Difference | |
| 91 Day T-bill | 12.75% | 19.44% | 6.69% |
| 182 Day T-Bill | 13.51% | 20.58% | 7.07% |
| 364 Day T-Bill | 16.42% | 21.89% | 5.47% |
| 2 Year T-Note | 18.05% | 21.50% | 2.70% |
| 3 Year T-Bond | 17.70% | 22.93% | 5.23% |
| 5 Year T-Bond | 18.80% | 22.30% | 3.50% |
Stock Market Performance
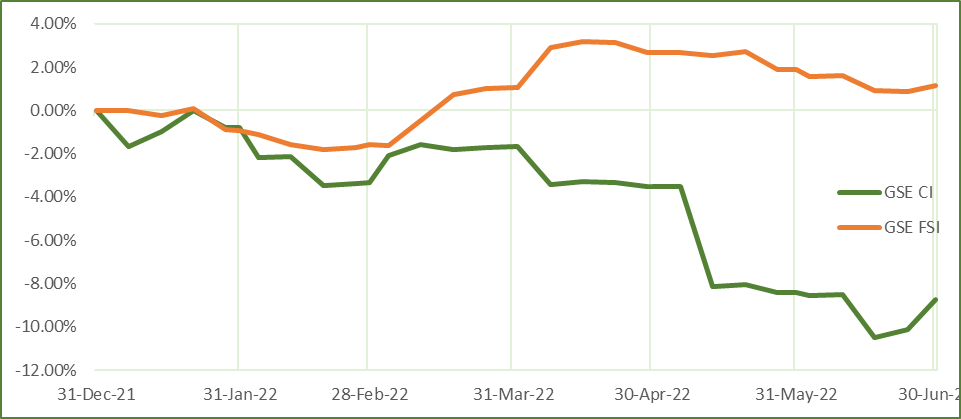
The GSE Composite Index (GSE-CI) and GSE Financial Stock Index (GSE-FSI) closed the second quarter of 2022 with year to date (YTD) returns of -8.74% and 1.17%, respectively compared to 36.40% and 6.05% at the end of June 2021. The GSE-FSI performed better than the GSE-CI due to major price recoveries in the following listed financial stocks – SIC, ETI and TBL.
During the quarter, there were 3 gainers. SIC was the top gainer with a quarterly return of 40.91%, closing the quarter at GH₵0.31. The rally was mainly due to investor confidence in the firm’s 2021 financial performance. The second gainer for the quarter was ACCESS which had a quarterly return of 20.10%. TBL was the third largest gainer ending the quarter at GH₵0.44 which represented a 10.00% quarterly gain. On the other hand, TOTAL led the pack of 6 losers, ending the quarter at GH₵4.10, representing a quarterly loss of 18.33% followed by MTNGH ending the quarter at GH₵0.86, which represented a 15.09% quarterly loss. The other losers were CAL, GCB, CAL, SOGEGH and GOIL which lost 6.98%, 3.10%, 0.84% and 0.55% respectively. Prices of 19 stocks remained flat.
The performance of the gainers and losers during the second quarter of 2022 on the GSE are detailed in the tables below.
Gainers
| Share | Year High | Year Low | 31st Mar 2022 (GH₵) | 30th Jun 2022 (GH₵) | YTD Gain | Quarter Gain |
| SIC | 0.31 | 0.08 | 0.22 | 0.31 | 287.50% | 40.91% |
| ACCESS | 3.15 | 1.9 | 2.09 | 2.51 | 20.32% | 20.10% |
| TBL | 0.44 | 0.34 | 0.4 | 0.44 | 29.41% | 10.00% |
Losers
| Share | Year High | Year Low | 31st Mar 2022 (GH₵) | 30th Jun 2022 (GH₵) | YTD Loss | Quarter Loss |
| TOTAL | 5.02 | 4.05 | 5.02 | 4.1 | 18.33% | 18.33% |
| MTNGH | 1.11 | 0.86 | 1.06 | 0.9 | 15.09% | 15.09% |
| CAL | 0.91 | 0.8 | 0.86 | 0.8 | 8.05% | 6.98% |
| GCB | 5.24 | 5 | 5.16 | 5 | 4.58% | 3.10% |
| SOGEGH | 1.2 | 1.18 | 1.19 | 1.18 | 1.67% | 0.84% |
| GOIL | 1.82 | 1.81 | 1.82 | 1.81 | 0.55% | 0.55% |
Developments in the Capital Market
On 29th June 2022, Asante Gold Corporation listed on the Ghana Stock Exchange by introduction of. Asante Gold Corporation which trades with the symbol ASG is an indigenous Ghanaian mining multinational, that has achieved growth on the Canadian Securities Exchange with a valuation in excess of US$400 million. The company intends to replicate this growth on the GSE and hence bring investment opportunities to Ghanaians.
Current Economic Environment and Investment Implications
Ghana’s fiscal situation remains a huge concern and other economic factors such as rising inflation and depreciation of the Ghana cedi continue to drive further slow growth of the economy. These developments have forced the government to initiate negotiations with the International Monetary Fund (IMF) for balance of payment support. Securing a facility from the IMF soon is crucial as it will help the country restore macroeconomic stability and anchor debt sustainability. With this said the government would have to brace itself for significant conditionalities associated with an IMF facility.
The cedi is likely to further depreciate during the next quarter due to an increase in imports, global inflation and rising energy and food prices.
Interest rates are expected to inch upwards largely fueled by inflationary pressures and for government to meet its financing needs through domestic issuances. On the capital market, the return of the GSE Composite Index is likely to be bearish as a result of capital flight to the fixed income market due to rising interest rates.